🚨 $INBS Stock Alert: FDA Progress, Revenue Growth and a Potential Technical Bottom

Intelligent Bio Solutions Inc. | Nasdaq: INBS
Market update: July 14, 2026
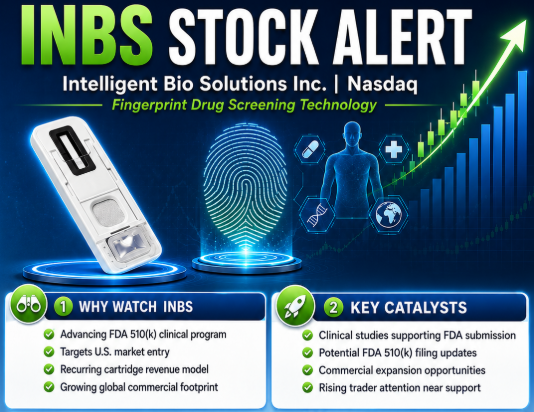
Intelligent Bio Solutions Inc. is entering a potentially important period as the medical-technology company advances multiple clinical studies supporting its planned FDA 510(k) submission while continuing to grow commercial sales outside the United States.
INBS develops a portable fingerprint-based drug screening system that analyzes fingerprint sweat. Sample collection takes seconds, with results available in under ten minutes. The company says its technology has been sold across 35 countries and territories and has more than 480 active customer accounts in industries including construction, mining, transportation, manufacturing, law enforcement and drug treatment.
Upcoming FDA-related catalysts
The primary catalyst for INBS is its effort to secure U.S. market clearance for its Intelligent Fingerprinting Drug Screening System.
On June 16, 2026, INBS announced that it had started an Interference Study involving 75 healthy adult participants. The study is designed to determine whether commonly encountered substances could affect the system’s ability to accurately detect codeine. Management expected the study to be completed by mid-July, with the results included in the company’s FDA 510(k) submission package.
The Interference Study is running alongside a multi-site Method Comparison Study involving 135 participants. That study is evaluating the system’s accuracy when operated by intended workplace users at multiple clinical locations. Enrollment and data collection were expected to be completed by the end of July 2026.
These studies follow the successful completion of the company’s initial clinical Cut-off Study. That study evaluated codeine detection levels in 40 adults and compared the results with an FDA-cleared predicate device and laboratory-based LC-MS/MS analysis.
Completion announcements or updated FDA submission guidance could become important near-term catalysts. However, completion of the studies does not guarantee FDA clearance or a successful U.S. commercial launch.
Revenue and recurring cartridge growth
INBS reported fiscal third-quarter 2026 revenue of approximately $1.06 million, representing growth of 46% year over year.
Cartridge revenue was the strongest part of the quarter:
Cartridge sales reached approximately $703,538, up 59%.
Cartridges represented 66% of quarterly revenue.
Gross margin improved to approximately 50.5%.
Nine-month revenue reached $3.07 million, up 39%.
Nine-month cartridge revenue increased 46% to $1.86 million.
The cartridge growth supports the company’s razor-and-razorblade business model. Reader placements expand the installed customer base, while replacement testing cartridges can produce recurring revenue as customers continue using the system.
Financial risks remain significant
Although revenue and margins are improving, INBS remains an early-stage and loss-making company.
For the quarter ended March 31, 2026, INBS reported a net loss of approximately $2.87 million. Its nine-month net loss was approximately $8.55 million, while net cash used in operations totaled approximately $8.74 million.
The company held approximately $6.86 million in cash and cash equivalents on March 31. However, management stated that this cash might be insufficient to fund its operating plan for the following 12 months and that additional financing would be required. The filing included substantial doubt regarding the company’s ability to continue as a going concern.
Potential dilution must also be monitored. As of March 31, the company reported warrants outstanding to purchase approximately 6.93 million shares, although the exercise prices and terms vary considerably. INBS has also previously raised capital through private placements, warrant exercises and an at-the-market offering program.
INBS chart analysis

INBS closed at $2.30 on July 13, gaining 6.48% for the session. Trading volume reached 195,534 shares compared with a 65-day average of 102,246 shares. Increasing price accompanied by above-average volume is a constructive short-term signal, but it does not yet confirm a major trend reversal.
The stock remains near the lower end of its 52-week range of $2.08 to $24.90. After briefly reaching $5.20 during a high-volume May rally, INBS entered a sustained decline and eventually tested $2.08 on June 25. Since then, the stock has been attempting to form a base between approximately $2.10 and $2.40.
Technical levels to watch
Immediate support: $2.25–$2.29
This area includes the latest breakout level and several recent closing prices. Holding above it would keep the short-term bounce intact.
Secondary support: $2.15–$2.20
Multiple July sessions traded or closed in this area. A move below $2.15 would weaken the current setup.
Critical support: $2.08
This is the current 52-week low and the most important downside level. A decisive break below $2.08 would represent a bearish technical development.
First resistance: $2.35–$2.40
INBS has repeatedly encountered selling pressure around this zone. A strong close above $2.40, supported by elevated volume, would provide the first meaningful breakout confirmation.
Next resistance: $2.45–$2.55
This range contains several early-June highs and closing prices. Reclaiming it would improve the short-term chart structure.
Major resistance: $2.63–$2.80
This was a major trading area during late May. It could contain additional overhead supply from traders who purchased before the decline.
These levels are inferred from recent historical price and volume activity and may change rapidly.
Bullish and bearish scenarios
The bullish scenario would involve INBS holding above $2.25, breaking through $2.40–$2.46 and sustaining the move on above-average volume. That could open a technical path toward $2.55, followed by the $2.63–$2.80 zone.
The bearish scenario would involve rejection near $2.35–$2.40 followed by a loss of $2.20. A break below $2.15 could lead to another test of the $2.08 low. Because INBS is a low-priced micro-cap stock, percentage moves can be unusually large in either direction.
Why INBS belongs on the watchlist
INBS offers a combination of identifiable clinical catalysts, improving revenue, expanding cartridge demand and a chart trading close to major support. The company’s FDA studies expected around mid-to-late July could attract increased speculative attention.
Nevertheless, the stock remains highly risky. INBS is still generating substantial operating losses, additional financing may be required, dilution is possible, and FDA clearance is not guaranteed.
Bottom line
INBS is a speculative catalyst watch, not a confirmed long-term technical reversal.
The chart becomes more constructive above $2.40–$2.46, while $2.08–$2.15 remains the critical downside zone. Traders should watch study-completion announcements, FDA submission updates, trading volume and future financing filings.
Research links
Disclosure: This article is for informational purposes only and is not financial advice. Always conduct your own research.


Comments